외부 라이브러리 모듈화
이유
Vue.js 관련 라이브러리가 없을 때 일반 라이브러리를 결합할 수 있어야 한다.
종류
- Chart
- DatePicker
- Table
- Spinner
- ...
외부 라이브러리 모듈화 실습하기
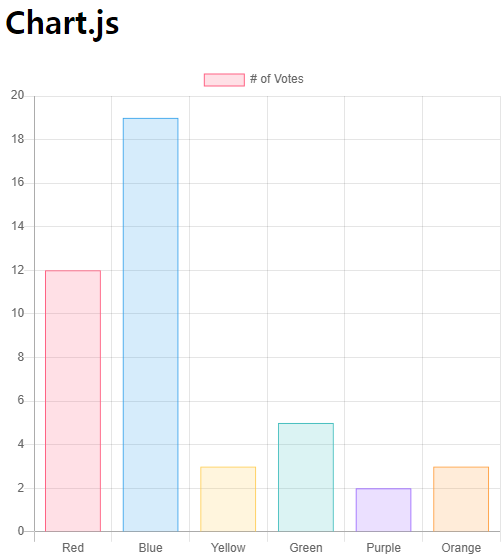
chart.js 이용하여 차트 라이브러리 설치 및 차트 그리기 실습
1. npm i chart.js 실행하여 차트 라이브러리 설치
// Terminal
jskim@DESKTOP-SI6DJ17 MINGW64 /d/dev/study/vue-charts/chart-lib (master)
$ npm i chart.js
2. App.vue에 설치한 라이브러리 import
import Chart from 'chart.js';3. mounted() 라이프 사이클 훅에서 차트 그리기 (ref 속성)
<template>
  <div>
    <h1>Chart.js</h1>
    <canvas id="myChart" width="400" height="400"></canvas>
  </div>
</template>

<script>
import Chart from 'chart.js';

export default {
  // mounted : DOM이 삽입되는 라이프 사이클
  mounted() {
    var ctx = document.getElementById("myChart");
    var myChart = new Chart(ctx, {
      type: "bar",
      data: {
        labels: ["Red", "Blue", "Yellow", "Green", "Purple", "Orange"],
        datasets: [
          {
            label: "# of Votes",
            data: [12, 19, 3, 5, 2, 3],
            backgroundColor: [
              "rgba(255, 99, 132, 0.2)",
              "rgba(54, 162, 235, 0.2)",
              "rgba(255, 206, 86, 0.2)",
              "rgba(75, 192, 192, 0.2)",
              "rgba(153, 102, 255, 0.2)",
              "rgba(255, 159, 64, 0.2)",
            ],
            borderColor: [
              "rgba(255, 99, 132, 1)",
              "rgba(54, 162, 235, 1)",
              "rgba(255, 206, 86, 1)",
              "rgba(75, 192, 192, 1)",
              "rgba(153, 102, 255, 1)",
              "rgba(255, 159, 64, 1)",
            ],
            borderWidth: 1,
          },
        ],
      },
      options: {
        scales: {
          yAxes: [
            {
              ticks: {
                beginAtZero: true,
              },
            },
          ],
        },
      },
    });
  },
};
</script>
Vue 에서 DOM을 접근하는 ref 속성
<div ref="app" id="app">hello</hello>

<script>
  // document 방식
  var divElement = document.getElementById('app');
  var divElement = document.querySelector('#app');
  // jQuery 방식
  var divElement = $('#app');
  // Vue 방식
  var divElement = this.$refs.app;
</script>
※ ESLint 오류 관련
Vue CLI 3 버전 후반대부터 현재 4버전까지 ESLint 에러를 화면에 노출시키고 있는데, 다시 예전처럼 명령어 입력창 레벨로 내리려면 vue.config.js 파일을 생성하여 아래의 내용을 입력하면 된다.
module.exports = {
  devServer: {
    overlay: false
  }
}
4. 차트 컴포넌트화 하기
(1) src/components/BarChart.vue 생성
<template>
  <canvas id="myChart" width="400" height="400"></canvas>
</template>

<script>
import Chart from "chart.js";

export default {
  mounted() {
    var ctx = document.getElementById("myChart");
    var myChart = new Chart(ctx, {
      type: "bar",
      data: {
        labels: ["Red", "Blue", "Yellow", "Green", "Purple", "Orange"],
        datasets: [
          {
            label: "# of Votes",
            data: [12, 19, 3, 5, 2, 3],
            backgroundColor: [
              "rgba(255, 99, 132, 0.2)",
              "rgba(54, 162, 235, 0.2)",
              "rgba(255, 206, 86, 0.2)",
              "rgba(75, 192, 192, 0.2)",
              "rgba(153, 102, 255, 0.2)",
              "rgba(255, 159, 64, 0.2)",
            ],
            borderColor: [
              "rgba(255, 99, 132, 1)",
              "rgba(54, 162, 235, 1)",
              "rgba(255, 206, 86, 1)",
              "rgba(75, 192, 192, 1)",
              "rgba(153, 102, 255, 1)",
              "rgba(255, 159, 64, 1)",
            ],
            borderWidth: 1,
          },
        ],
      },
      options: {
        scales: {
          yAxes: [
            {
              ticks: {
                beginAtZero: true,
              },
            },
          ],
        },
      },
    });
  },
};
</script>
(2) App.vue에 BarChart.vue 임포트
<template>
  <div>
    <h1>Chart.js</h1>
    <!-- BarChart 추가 -->
    <bar-chart></bar-chart>
  </div>
</template>

<script>
// BarChart import
import BarChart from './components/BarChart.vue';

export default {
  // 컴포넌트 등록
  components: {
    BarChart,
  },
};
</script>
5. 컴포넌트의 플러그인화
(1) src/plugins/ChartPlugin.js 생성
import Chart from 'chart.js';

export default {
  // 다른 컴포넌트나 main.js에서 Vue.use(ChartPlugin)을 명시할 경우 ChartPlugin.install(Vue) 실행
  install(Vue) {
    // $_ 표기는 Vue 공식사이트에서 추천하는 표기법
    Vue.prototype.$_Chart = Chart;
  }
}
(2) main.js에 ChartPlugin.js 임포트 및 Vue use() 추가
import Vue from 'vue'
import App from './App.vue'
// ChartPlugin import
import ChartPlugin from './plugins/ChartPlugin.js';

Vue.config.productionTip = false
// ChartPlugin 사용
Vue.use(ChartPlugin);

new Vue({
  render: h => h(App),
}).$mount('#app')
(3) BarChart.vue, LineChart.vue 내 import Chart 제거
// BarChart.vue
<script>
// import Chart from "chart.js";

export default {
  mounted() {
    var ctx = this.$refs.barChart;
    var myChart = new Chart(ctx, {
      type: "bar",
      data: {
        labels: ["Red", "Blue", "Yellow", "Green", "Purple", "Orange"],
        datasets: [
          {
            label: "# of Votes",
            data: [12, 19, 3, 5, 2, 3],
            backgroundColor: [
              "rgba(255, 99, 132, 0.2)",
              "rgba(54, 162, 235, 0.2)",
              "rgba(255, 206, 86, 0.2)",
              "rgba(75, 192, 192, 0.2)",
              "rgba(153, 102, 255, 0.2)",
              "rgba(255, 159, 64, 0.2)",
            ],
            borderColor: [
              "rgba(255, 99, 132, 1)",
              "rgba(54, 162, 235, 1)",
              "rgba(255, 206, 86, 1)",
              "rgba(75, 192, 192, 1)",
              "rgba(153, 102, 255, 1)",
              "rgba(255, 159, 64, 1)",
            ],
            borderWidth: 1,
          },
        ],
      },
      options: {
        scales: {
          yAxes: [
            {
              ticks: {
                beginAtZero: true,
              },
            },
          ],
        },
      },
    });
  },
};
</script>

// LineChart.vue
<script>
// import Chart from 'chart.js';

export default {
  mounted() {
    var ctx = this.$refs.lineChart.getContext("2d");
    var chart = new Chart(ctx, {
      // The type of chart we want to create
      type: "line",

      // The data for our dataset
      data: {
        labels: [
          "January",
          "February",
          "March",
          "April",
          "May",
          "June",
          "July",
        ],
        datasets: [
          {
            label: "My First dataset",
            backgroundColor: "rgb(255, 99, 132)",
            borderColor: "rgb(255, 99, 132)",
            data: [0, 10, 5, 2, 20, 30, 45],
          },
        ],
      },

      // Configuration options go here
      options: {},
    });
  },
};
</script>
6. 컴포넌트 통신을 이용한 차트 컴포넌트 기능 결합
결합력 높은 차트 컴포넌트 모듈 제작하기
(1) dataset을 props 속성을 이용해 내려받기
<template>
  <canvas ref="barChart" id="barChart" width="400" height="400"></canvas>
</template>

<script>
export default {
  // App.vue로부터 data 전달받음
  props: ["propsdata"],
  mounted() {
    var ctx = this.$refs.barChart;
    var myChart = new Chart(ctx, {
      type: "bar",
      data: {
        labels: ["Red", "Blue", "Yellow", "Green", "Purple", "Orange"],
        // App.vue로 전달받은 dataset 사용
        datasets: this.propsdata,
      },
      options: {
        scales: {
          yAxes: [
            {
              ticks: {
                beginAtZero: true,
              },
            },
          ],
        },
      },
    });
  },
};
</script>
(2) App.vue에서 BarChart.vue로 dataset 내려주기
<template>
  <div>
    <h1>Chart.js</h1>
    <!-- props 속성 이용 dataset 전달 -->
    <bar-chart v-bind:propsdata="chartDataSet"></bar-chart>
    <line-chart></line-chart>
  </div>
</template>

<script>
import BarChart from './components/BarChart.vue';
import LineChart from './components/LineChart.vue';

export default {
  components: {
    BarChart,
    LineChart,
  },
  data() {
    return {
      chartDataSet: [
          {
            label: "# of Votes",
            data: [12, 19, 3, 5, 2, 3],
            backgroundColor: [
              "rgba(255, 99, 132, 0.2)",
              "rgba(54, 162, 235, 0.2)",
              "rgba(255, 206, 86, 0.2)",
              "rgba(75, 192, 192, 0.2)",
              "rgba(153, 102, 255, 0.2)",
              "rgba(255, 159, 64, 0.2)",
            ],
            borderColor: [
              "rgba(255, 99, 132, 1)",
              "rgba(54, 162, 235, 1)",
              "rgba(255, 206, 86, 1)",
              "rgba(75, 192, 192, 1)",
              "rgba(153, 102, 255, 1)",
              "rgba(255, 159, 64, 1)",
            ],
            borderWidth: 1,
          },
        ],
    }
  },
};
</script>
동작 확인

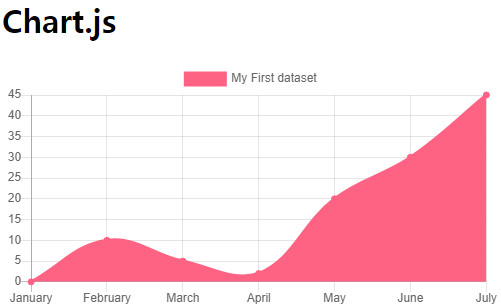
LineChart 구현하기
1. src/components/LineChart.vue 생성
<template>
  <canvas ref="lineChart" id="lineChart"></canvas>
</template>

<script>
import Chart from 'chart.js';

export default {
  mounted() {
    // Vue 방식으로 접근 시 해당 컴포넌트에만 유효
    var ctx = this.$refs.lineChart.getContext("2d");
    var chart = new Chart(ctx, {
      // The type of chart we want to create
      type: "line",

      // The data for our dataset
      data: {
        labels: [
          "January",
          "February",
          "March",
          "April",
          "May",
          "June",
          "July",
        ],
        datasets: [
          {
            label: "My First dataset",
            backgroundColor: "rgb(255, 99, 132)",
            borderColor: "rgb(255, 99, 132)",
            data: [0, 10, 5, 2, 20, 30, 45],
          },
        ],
      },

      // Configuration options go here
      options: {},
    });
  },
};
</script>
2. App.vue에 LineChart.vue 임포트
<template>
  <div>
    <h1>Chart.js</h1>
    <line-chart></line-chart>
  </div>
</template>

<script>
import LineChart from './components/LineChart.vue';

export default {
  // 컴포넌트 속성 & 인스턴스 옵션이 들어가는 구간
  components: {
    LineChart,
  },
};
</script>

<style>
</style>
동작 확인

'Dev > Vue.js' 카테고리의 다른 글
| [Vue.js] Hacker News - 서비스 배포 환경 구성 (0) | 2020.10.07 |
|---|---|
| [Vue.js] Hacker News - 컴포넌트 디자인 패턴 (0) | 2020.10.07 |
| [Vue.js] Hacker News - Async & Await를 이용한 비동기 처리 (0) | 2020.09.25 |
| [Vue.js] Hacker News - 데이터 호출과 UX (0) | 2020.09.25 |
| [Vue.js] HackerNews - Mixin과 하이 오더 컴포넌트 (0) | 2020.09.24 |
댓글